Using Pinpoint data to analyse energy drink sales in UK Convenience
4 March 2024
Author: Linzi McGuire

Energy drinks are big business in the UK. For many consumers, these are part of their daily rituals and help them get through the day. Competition is fierce in this category with a huge number of brands fighting for market share.
Until now, the convenience sector has typically been data dry, or at the very least, the limited data that’s available was unreliable to use for strategy planning and unavailable in the moment. But a recent emergency of new technology like Pinpoint allows brands to understand how their brands are performing, down to region, store and facia level. They can compare against the category and see how competitors are performing, understand how their promotions are landing, and see where distribution could be improved. They can even see percentage of basket spend and track which times of day that sales are made.
So, energy drinks brands, do you know your share of sales by day? Do you know your share of Energy drinks by hour? We do.
Energy drink sales snapshot in UK Convenience:
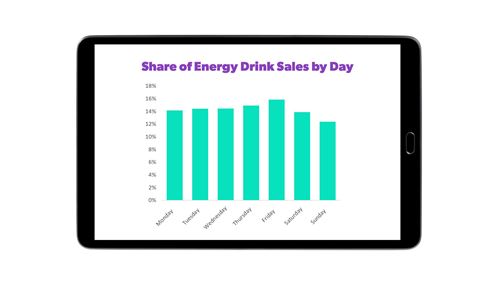
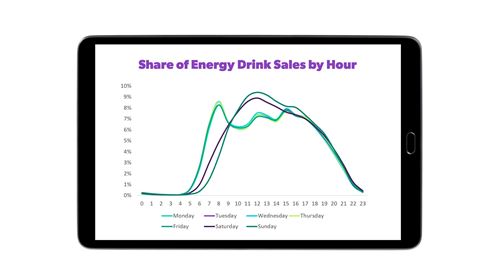
When are energy drinks being bought?
Friday is the day with the highest sales of Energy Drinks, while Sunday has the lowest sales.
Data also shows the difference between sales in the week and the weekend. During the week there are 3 peaks in sales – 8am, lunchtime and 4pm. At the weekend the sales are more even peaking at midday.
Access the data and get the jump of your competition:
If you think your brand would benefit from data like this and more, talk to us about Pinpoint. Pinpoint data will help you understand how your brand and category are performing in Convenience and get the upper hand over competitors.
