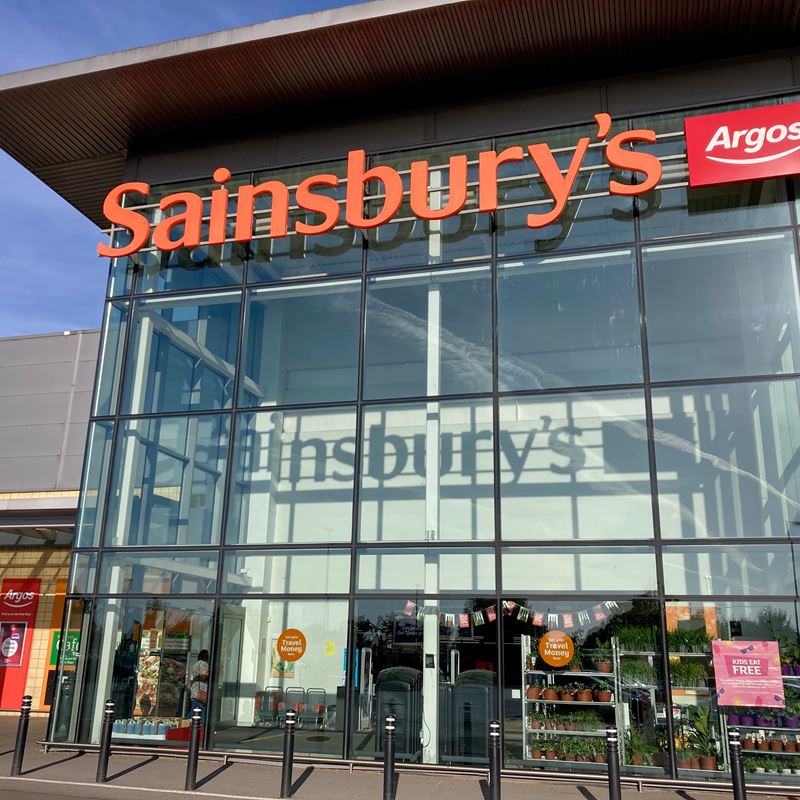
Thumbprint Insight: How did the top 4 retailers perform in the lead up to the festive period?
31 January 2025
Author:

This month’s insight comes from the Grocery sector with exclusive data insights from our platform DART. Our Thumbprint Managing Director, Gordon Neil focuses on performance of the top four retailers during the festive period. We're going to take in the lead up to the Christmas period to have a look at how they performed and potentially how that drove some of their financial results over that period of time.
Watch the full video below:
So, let's start with a high level view of availability. What we're doing here is comparing availability over the last 3 months to the previous 12 months and what we can see that across all of the retailers except Morrison's, is a marginal increase in their availability in the last 3 months at a rolled up level versus the last 12 months in total.However, once we dig below the surface level of that, we can start to see a trend within the 3 months itself.
When we track availability week by week over the course of 3 months we can start to see that the only retailer that's showing any improvement over the course of the 3 months and from a best fit basis is Sainsbury's. Then you can see with Asda there is a significant decrease in their availability over the course of the entire period when we best fit it.
You can also see that that availability has been quite erratic over that period. When we translate this availability into loss sales value, as in how much other retailers are losing because of it, we can see that Sainsbury's actually reduced the amount of sales they're losing because of availability over the three months in the lead up to Christmas versus the last twelve. Whereas every other re-retailer had an increased level of loss sales due to availability over that period. So, overall a good story in Sainsbury's in the last few months.
That actually translates into all of the categories, that we measure with the exception of the daily category, which we might expect to see some decrease in availability in the lead up to Christmas. However, every other category that we measure has seen an increase of availability over that period, with the exception, again, of the daily category and actually, BWS was flat over that period.
Let's dig below the surface again and have a look at what that actually means day by day, week by week, or what we can see when we look at that is, even with that good headline story in Sainsbury's, which may be one of the reasons. That's why they've reported such strong financial performance in the lead up to the Christmas period.
There’s actually a lot of instability in their availability, and particularly in the BWS and chilled category. If you look at the blue line in the middle, which is BWS, probably one of the most erratic categories in terms of availability in the lead up to Christmas. So, even with that strong availability performance, potentially part of the reason it's translated into strong financial performance is that you can still see that there are some categories where, with some focus, there's still significant headline room for improvement in the availability.
Lastly, let's look at what's been happening day by day. What we can see in that is that stability and availability actually try to translate really nicely into day by day basis. So although, some of the elements of this chart can look quite erratic, in reality, there's only a 10% basis point in difference in availability between the best and worst days in Sainsbury's across the course of the week. So that, that suggests a retailer who's got particularly stable execution at the moment. They are on an upward curve in terms of their execution. This is helping them reduce the amount of sales they're losing because of availability. This is a great story and also potentially a good reason why shoppers are trusting them and that's translating into their financial performance. So, very strong performance there from Sainsbury's, still some room for improvement, but particular room for improvement across all other top four retailers.
Join us next quarter as we share more insights.
You can also follow us on LinkedIn here to stay up to date with our latest updates.
Find out how our data insights can help your brand boost sales performance and stock availability in key retail sectors: Get In Touch | thumbprint